|
|
|
|
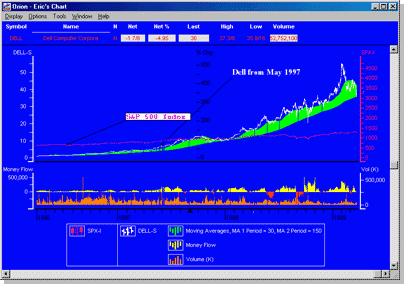
eTelemet's Intraday and Historical Price Charts show an issue's recent trading patterns within the context of its price history. eTelemet charts are used for decision making and tracking. The chart above shows a history of Dell compared to the S&P 500. Note the 30 and 150 day moving averages. Trading volume and money flow are also shown. Up to Four Overlays! Up to four issues and indices can be charted together on equivalent scales. Thirty Indicators! RSI, oscillators, moving averages, on balance volume, money flow, regression analyses are among a host of indicators each with user defined weights, periods and shifts. Personalized Charts with Custom Colors and Text Annotation Each chart can be personalized. Put your name, dates and comments on the chart. All colors and legends are selectable. Text notes can be put on the chart to annotate interesting points. Custom Charts at Your Fingertips Build charts with all the indicators and analytics you want. Then save these. It's so easy to select a study with the click of a mouse! See Details in Seconds! Telemet's zoom feature lets you view all the data you want with a click of the mouse. Zoom in to see just a few days, then out to see a broader perspective. Call to order eTelemet today @ 1-800-368-2078. |
Home | Features | Pricing | Subscribe | www.taquote.com |
| Telemet
America, Inc. 325 First Street Alexandria, VA 22314 www.taquote.com / www.etelemet.com |
|